Available for E-Commerce Audit Engagements
I Identify the Margin Leaks Destroying Your Profitability.
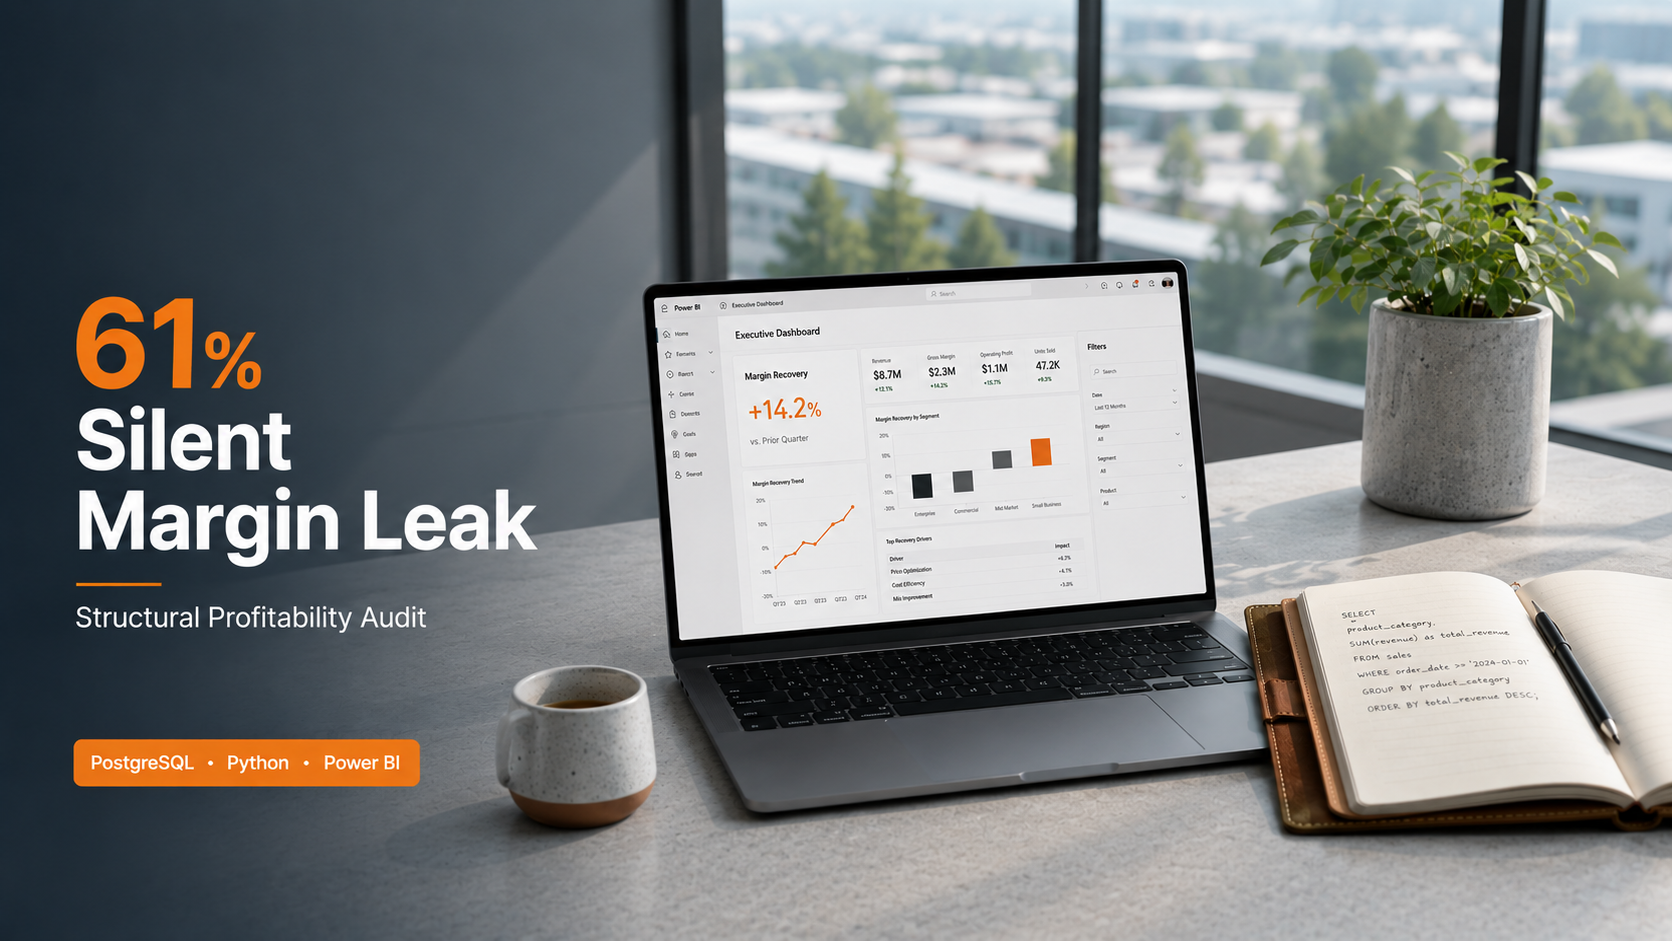
Helping e-commerce founders recover margin by auditing discount behaviour, inventory inefficiency, and operational drag — then translating that evidence into decisions that protect profitability, not just revenue.
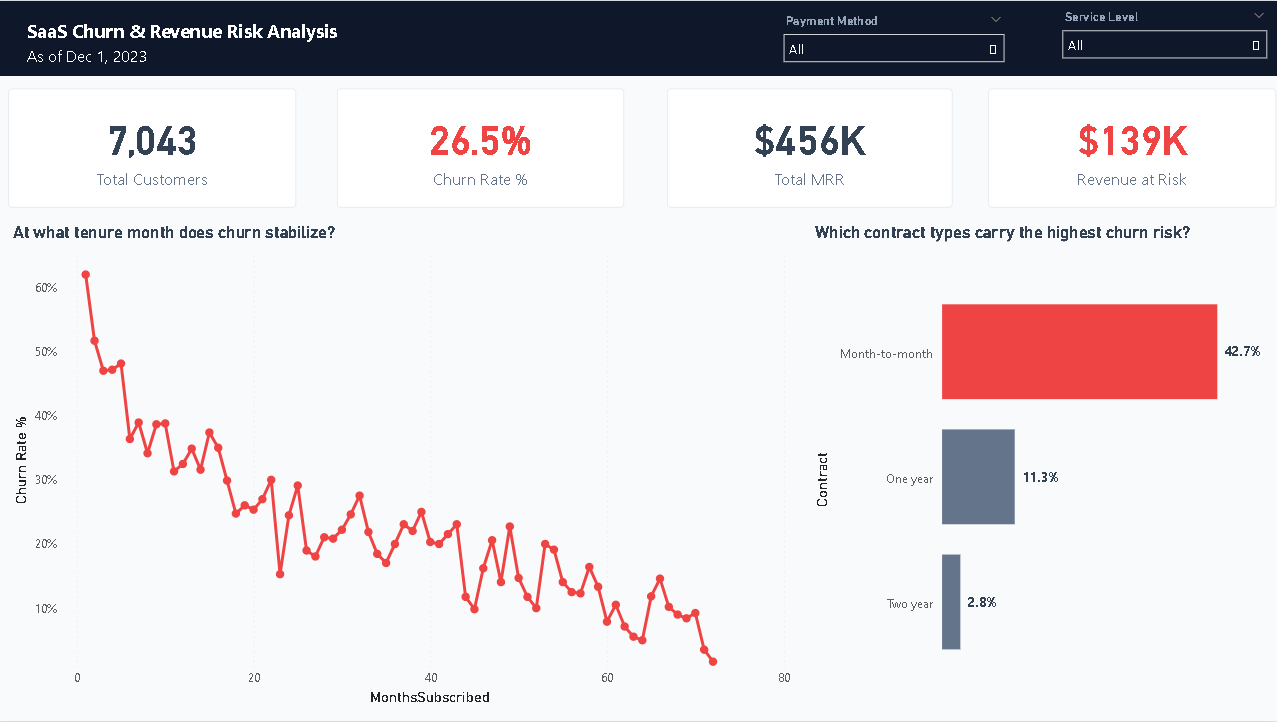
$139K MRR Leak Quantified
61% Discount Rate Audited
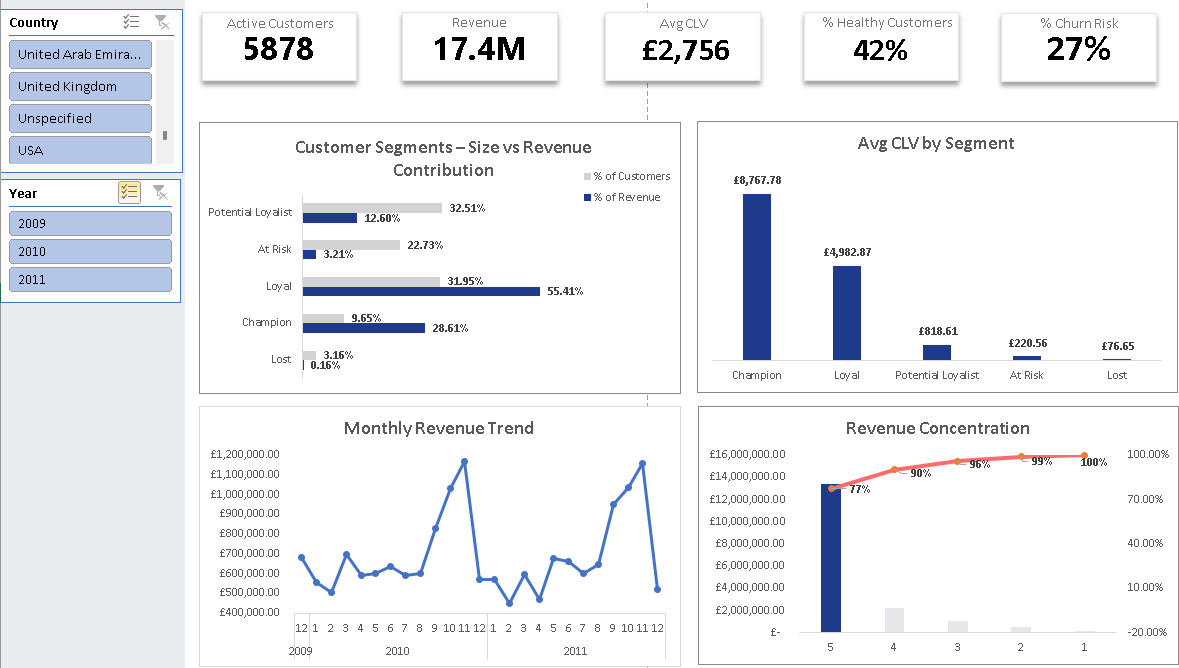
£390K+ Revenue Opportunity Surfaced

Audits Completed
6 Case Studies
BI Dashboards
3+ Delivered
Scroll